Timing 2008: what was the prize?
With the bull market continuing, more and more people “predict” the crisis. Obviously, there is a temptation to try to time the market. Let’s try to estimate the best outcome of timing the market by considering the 2008 crisis. Perhaps it is not worth it at all (spoiler: the returns of ideal timing are actually substantial).
Getting the data
Before simulating anything, we need the data. First, I arbitrarily select the following companies to analyze:
-
‘AAPL’, ‘AMZN’, ‘GOOGL’ - Apple, Amazon and Google, since IT companies were not that much affected by the crisis from the operational perspective and if I were hypothetically timing the market buying them would seem safer.
-
‘BAC’ - Bank of America as an example of a bank.
-
‘WMT’ - Walmart as an example of company which should not be affected much by the crisis (people still need their groceries). At least Motley Fool says so.
-
‘^GSPC’ - S&P500 index as a proxy for the US.
-
‘IWRD.AS’ - World index as a proxy for the world. Unfortunately plenty of world ETFs were created after the crisis, so this is the only I found with enough data.
Then I just manually downloaded daily prices for these tickers from https://finance.yahoo.com/ (dates: 1st of Jan 2006 - 1st of Jan 2014).
You can get the same data by inserting the ticker in
https://finance.yahoo.com/quote/
/history?period1=1136073600&period2=1388534400&interval=1d&filter=history&frequency=1d
and then manually clicking “Download Data”.
Methodology
Let’s consider time period from 3rd of Jan 2006 to 3rd of Jan 2013. You may be wondering why 3rd and not 1st - because there is no data for 1st and 2nd.
First, we consider buy&hold outcome, i.e. one buys on 3rd of Jan 2006 and then sells on 3rd of Jan 2013. When buying we take “high” price of the day and when selling - “low”. This gives us baseline to compare to. I.e. if one does not time the market, this is their return.
Second, let’s consider an investor who times the market, but only once. In other words they buy on 3rd of Jan 2006. Then at some point during the crisis they sell. Then eventually they rebuy. Finally, they sell again on 3rd of Jan 2013. Let’s enumerate all possibilities to sell and rebuy and find the best ones.
When timing the market, I also take “high” price of the day for buying and “low” for selling. This gives lower bound.
Results
World
Buy&hold investor’s ROI is -3.5% (bought @ 22.82$ on 2006/01/03, sold @ 22$ on 2013/01/03). Let’s have a look at daily prices during this period:
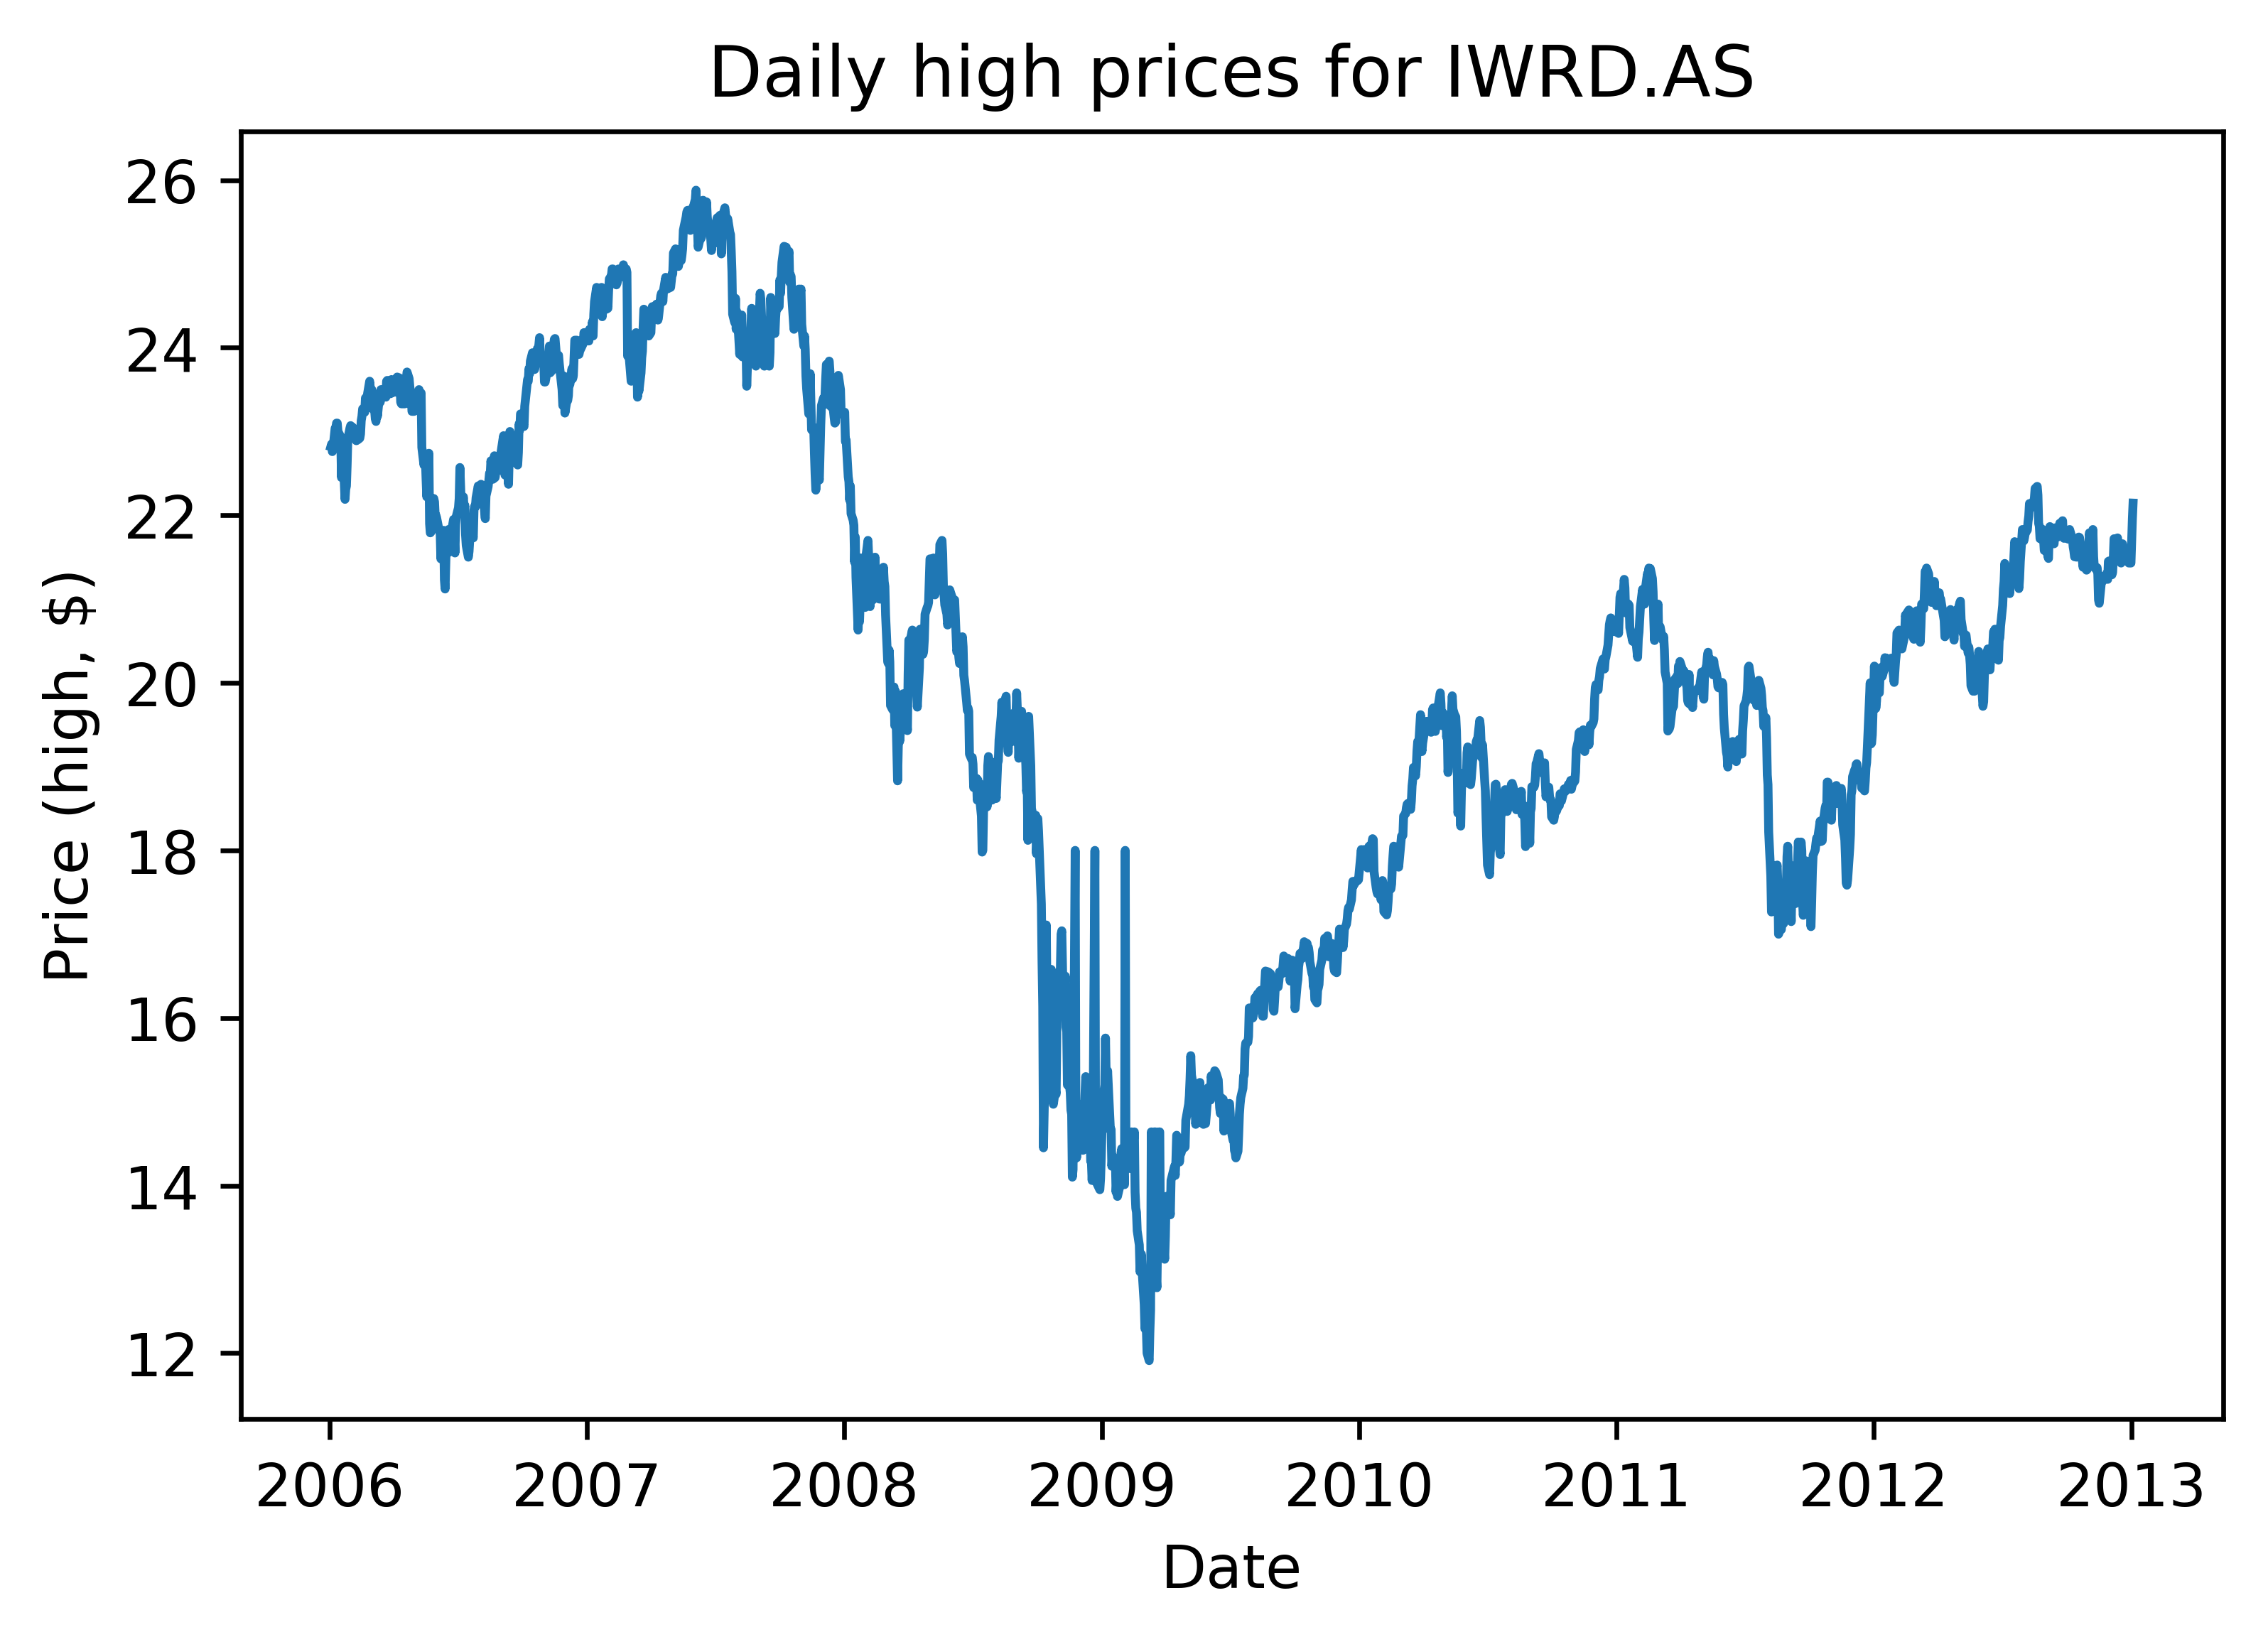
As we can see, the fall has started in 2007 and the recovery in 2009. It is peculiar to observe how many times it grew during the crisis and then felt back again. Timing that wouldn’t be fun.
If we time the world index once, our ROI becomes whooping 107.26% (sold @ 25.6$ on 2007/06/04, bought @ 11.91$ on 2009/03/09). Visually:
The red line connects sell and rebuy points.
One can definitely see that figuring out when to rebuy in practice wouldn’t be easy at all. There are plenty of small recoveries before the actual minimum of 2009.
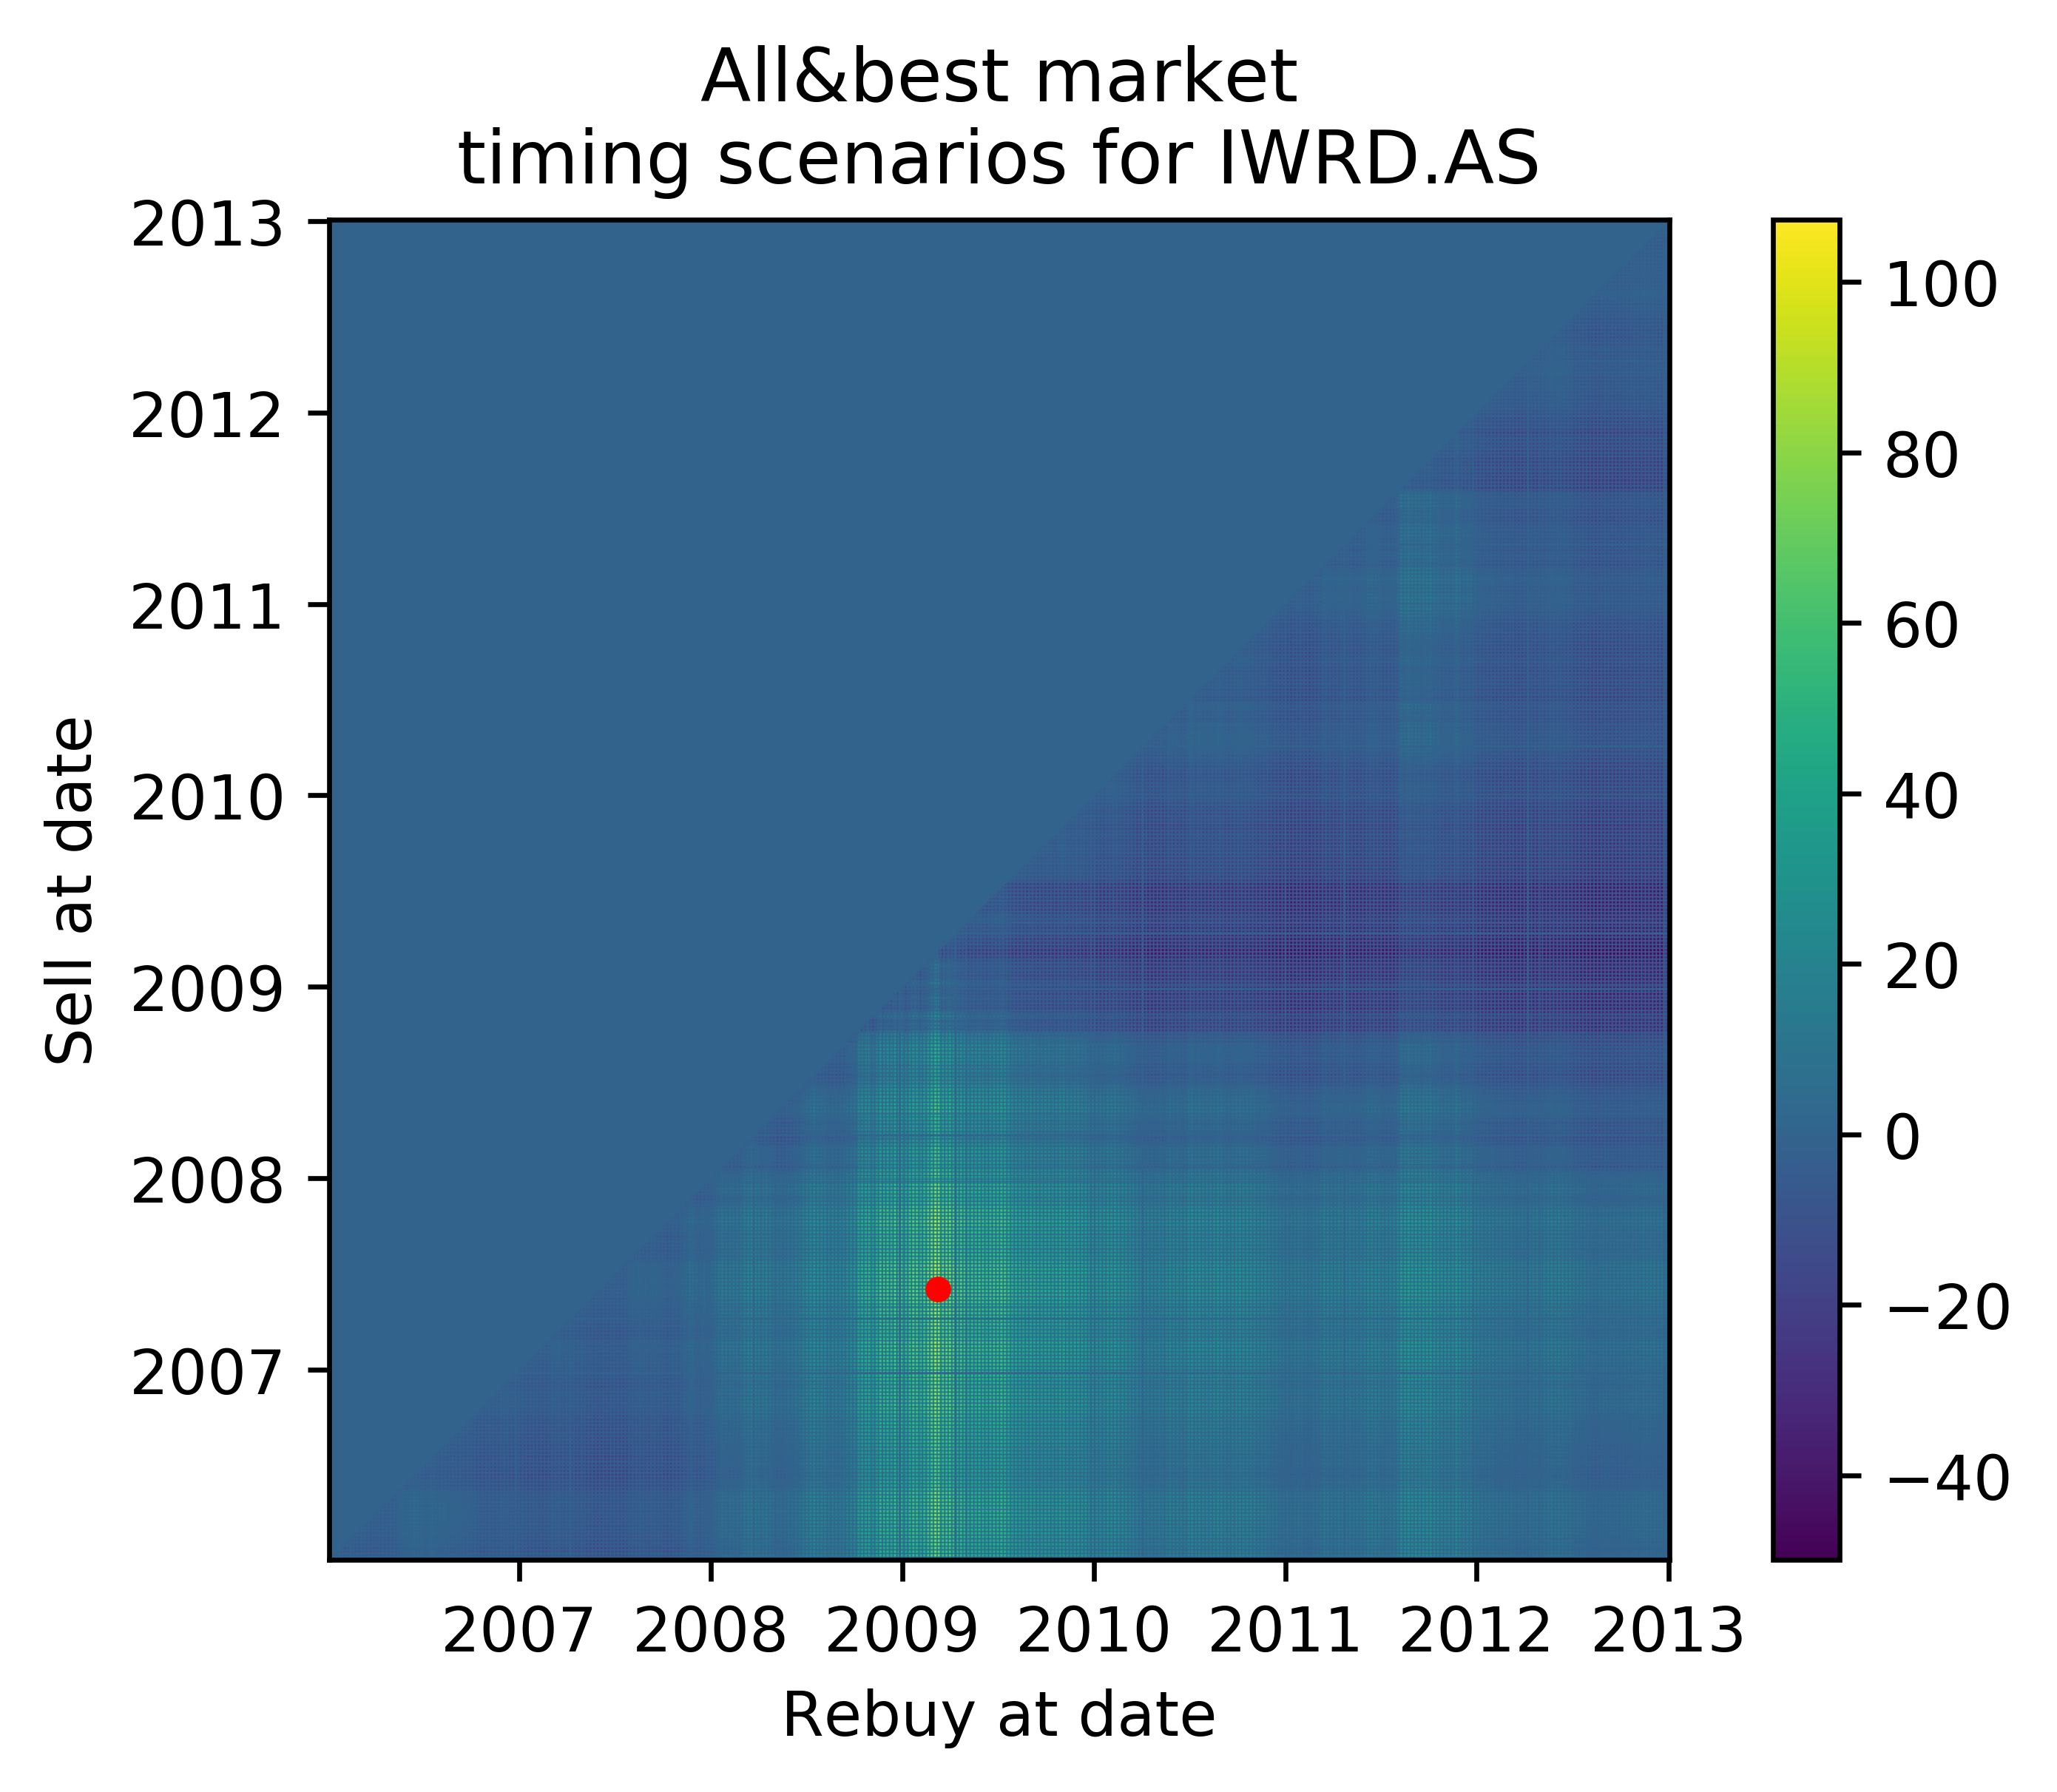
Let’s now consider all possible scenarios:
This may be confusing to read, but please bear with me. Let’s say you sell in 2007. This corresponds to horizontal line at 2007 (i.e. pick 2007 on the vertical axes). Then let’s say you rebuy in 2012. This means that you pick 2012 on horizontal axes. Your ROI is the intersection of the two. I.e. this plot represents all possible ways to time the market and their outcomes. As we can see, rebuying around 2009 is generally better than others and selling around 2009 was a bad idea. Also if you misstimed the market, you would reach ~-40% ROI.
Please note that I interpolate the missing days (e.g. holidays) by taking average of neighbors. This just fills the holes in the graph, otherwise it is impossible to read (and if you don’t believe me here is an example).
As we can see, timing the market through World Index in the best case would be very profitable (one could have 107.26% after 7 years instead of -3.5%). However, it is definitely not easy. When looking at all possible timing scenarios there is a lot of blue-purple (which is 0 or negative return). Another problem is that there are plenty of smaller drops and recoveries during the crisis.
Apple
Buy&hold investor got 623.74% return (bought @ 10.67$ on 2006/01/03, sold @ 77.28$ on 2013/01/03).
Daily prices and best market timing:
There was plenty of growth after the crisis. The best timing scenario return is 1645.81% (sell @ 28.25 on 2007/12/27, rebuy @ 11.71 on 2009/01/20). In some sense by doing this, one doubles their holdings and thus boosts the effect of the great growth afterwards.
As we can see the “hot” area is much-much smaller than before.
Amazon
You know the drill now, so I will just add the numbers and graphs without too many words.
Buy&hold: 435.77% return (bought @ 47.84$ on 2006/01/03, sold @ 256.36$ on 2013/01/03)
Best market timing: 1201.66% (sell @ 94.75$ on 2007/10/09, rebuy @ 39$ on 2008/11/21).
The peak returns area is very small now.
Buy&hold: 65.42% return (bought @ 218.05$ on 2006/01/03, sold @ 360.72$ on 2013/01/03)
Best market timing: 345.24% (sell @ 362.86$ on 2007/11/06, rebuy @ 134.81$ on 2008/11/21).
I am surprised how small buy&hold returns are.
Bank of America
Buy&hold: -74.81% return (bought @ 47.18$ on 2006/01/03, sold @ 11.88$ on 2013/01/03)
Best market timing: 293.26% (sell @ 54.82$ on 2006/11/17, rebuy @ 3.51$ on 2009/03/05).
Oh, the buy&hold return is scary and rebuying at 3$ per share is very peculiar.
Walmart
Buy&hold: 46.54% return (bought @ 46.66$ on 2006/01/03, sold @ 68.37$ on 2013/01/03)
Best market timing: 91.92% (sell @ 61.58$ on 2008/09/12, rebuy @ 47.02$ on 2009/02/02).
This one looks surprisingly easy to time (probably, because the timing does not bring that much return anyway).
S&P500
Buy&hold: 14.58% return (bought @ 1270.21$ on 2006/01/03, sold @ 1455.53$ on 2013/01/03).
Best market timing: 156.35% (sell @ 1545.45$ on 2007/10/10, rebuy @ 695.27$ on 2009/03/09).
Conclusions
Yes, timing 2008 well was a very profitable endeavor.
Follow-ups
I am now curious to estimate how hard it was to time the market. In the follow-up post I want to consider how badly could one time the market and still make reasonable profit. Also it makes sense to color all timing scenarios based on whether they outperform buy&hold.