Overview of this blog's life in 2019 and plans for 2020
I’ve got an idea to start a blog in the end of 2018 and published the first post in the early January of 2019. In other words, this blog is now kind of one year old. This was not my New Year resolution, but somehow it worked out. Let’s reflect a bit, see some stats and what I am going to do differently in 2020.
Prelude
To be honest I don’t remember precisely why I wanted to start this blog. It was probably an attempt to express myself, see what other people find interesting. However, with time these intentions mutated greatly. Currently I consider a blog as a nice lever for doing stuff I like. When I have an idea, I can not only do it, but also write about it on the blog and this increases the impact of my idea. Moreover, I do enjoy writing itself.
Proposed changes
However, this blog is a living organism on its own and I constantly experiment with my approach to it. And I definitely want to continue doing that.
In the second part of 2019 I have adopted two posts per week schedule. My hope was that this would make the blog more interesting to regular readers. I also usually scheduled 1 hour per post for writing and ~30 minutes for after-baking modifications (if you are confused by “baking”, I’ve described the process here). And as people often say - “you get what you measure”. As a result, many of my posts are rather short and somewhat shallow. I did do a couple posts which took much longer than allocated and I did enjoy working on them a lot (e.g. luckiest investor). Also it looked like others found such posts more interesting as well.
Thus, I am going to try to have no schedule from now on. As well as no time allocation per post. This means that I may “disappear” for longer, but eventually come back with much deeper posts (and hopefully of better quality).
This way I hope to preserve the part of the blog which I like (writing deep posts and exploring the topic well) and to get rid of less interesting parts (having to post something twice a week). The former was always a pure flow. The latter definitely felt like a chore sometimes.
In other words, I somewhat implicitly used to optimize for quantity. Quality might have been implicitly sacrificed. Again, this was all implicit, I just wanted regularity. Now I will try to optimize for quality and very likely quantity will suffer.
Expected challenges
I already see one possible issue with my new approach. I am quite a perfectionist and having strict deadlines helps me to fight that. However, without a schedule, I might polish a post forever. I am not sure how to counter that, perhaps some upper bound time limit per post. In any case, I will try to split the posts into smaller chunks and to publish them sooner this way.
Topics
I also hope that the new approach will change topic allocation of my posts. Due to allocated time limit in 2019 I often did write personal reflections on various topics. This is not bad per-se, but it is often very anecdotal, doesn’t have any proof and not that rigorous. I hope that with the new approach I will do more coding, simulations, deep rigorous posts with citations and sources.
Stats
Ok, now let’s look back and see how 2019 went for this blog.
I started time tracking in March and overall I spent at least 120 hours since then. This is clean time (i.e. just me actively doing something blog related) and might be a lower bound. This also includes various non-writing activities, e.g. Jekyll related fixes, actually posting stuff, updating twitter.
To be honest, this feels less than I expected. Overall there were 76 posts in 2019, 8 of which were before March. Thus, we are left with 68 posts in 120 hours or 1 hour 45 minutes per post. Funny enough this matches very closely my time allocation of 1 hour for writing and ~0.5 hour for after-baking corrections. Unfortunately, I don’t have time tracking with per post granularity, but I definitely remember that there was a lot of variation. Some posts did take 7-10 hours (very few though), some more like 10-20 minutes. After-baking fixes often took 5-10 minutes.
Let’s now analyze the posts themselves and build various graphs.
Post counts
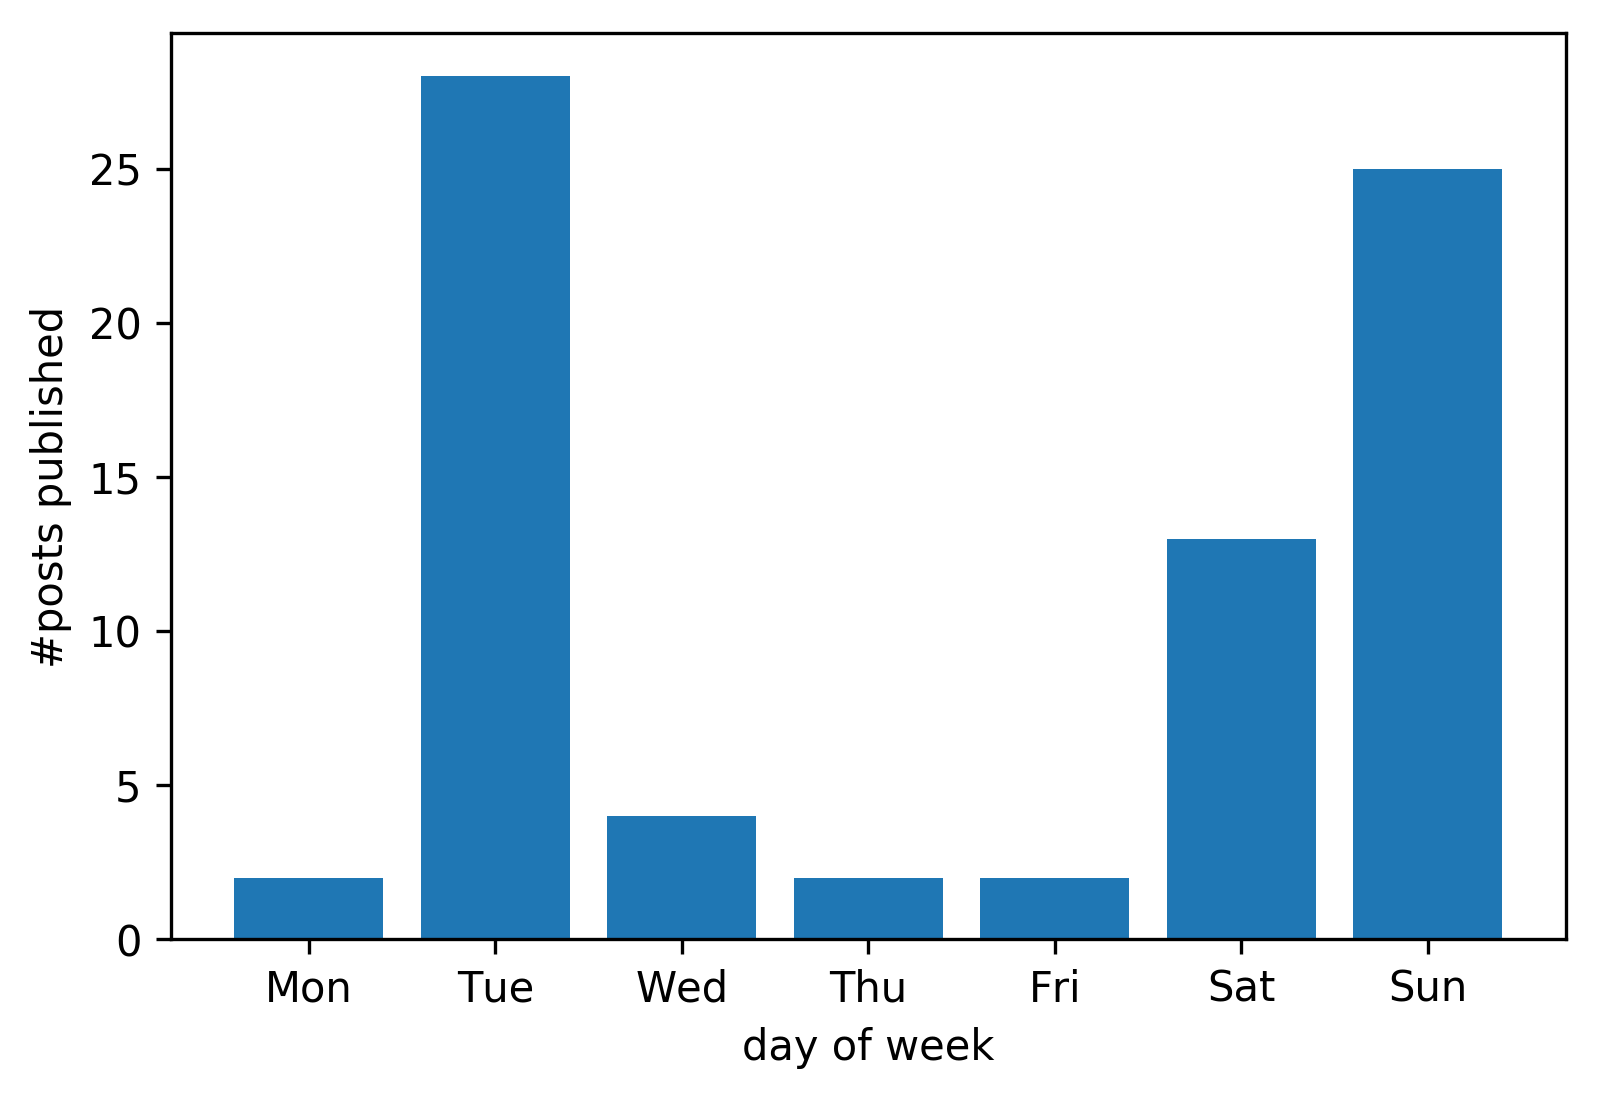
If we look at posts published over day of week, we definitely see my chosen Tuesday - Sunday schedule. Closer to the end of the year, I replaced Sunday with “weekend”, so that explains the Saturday’s value.
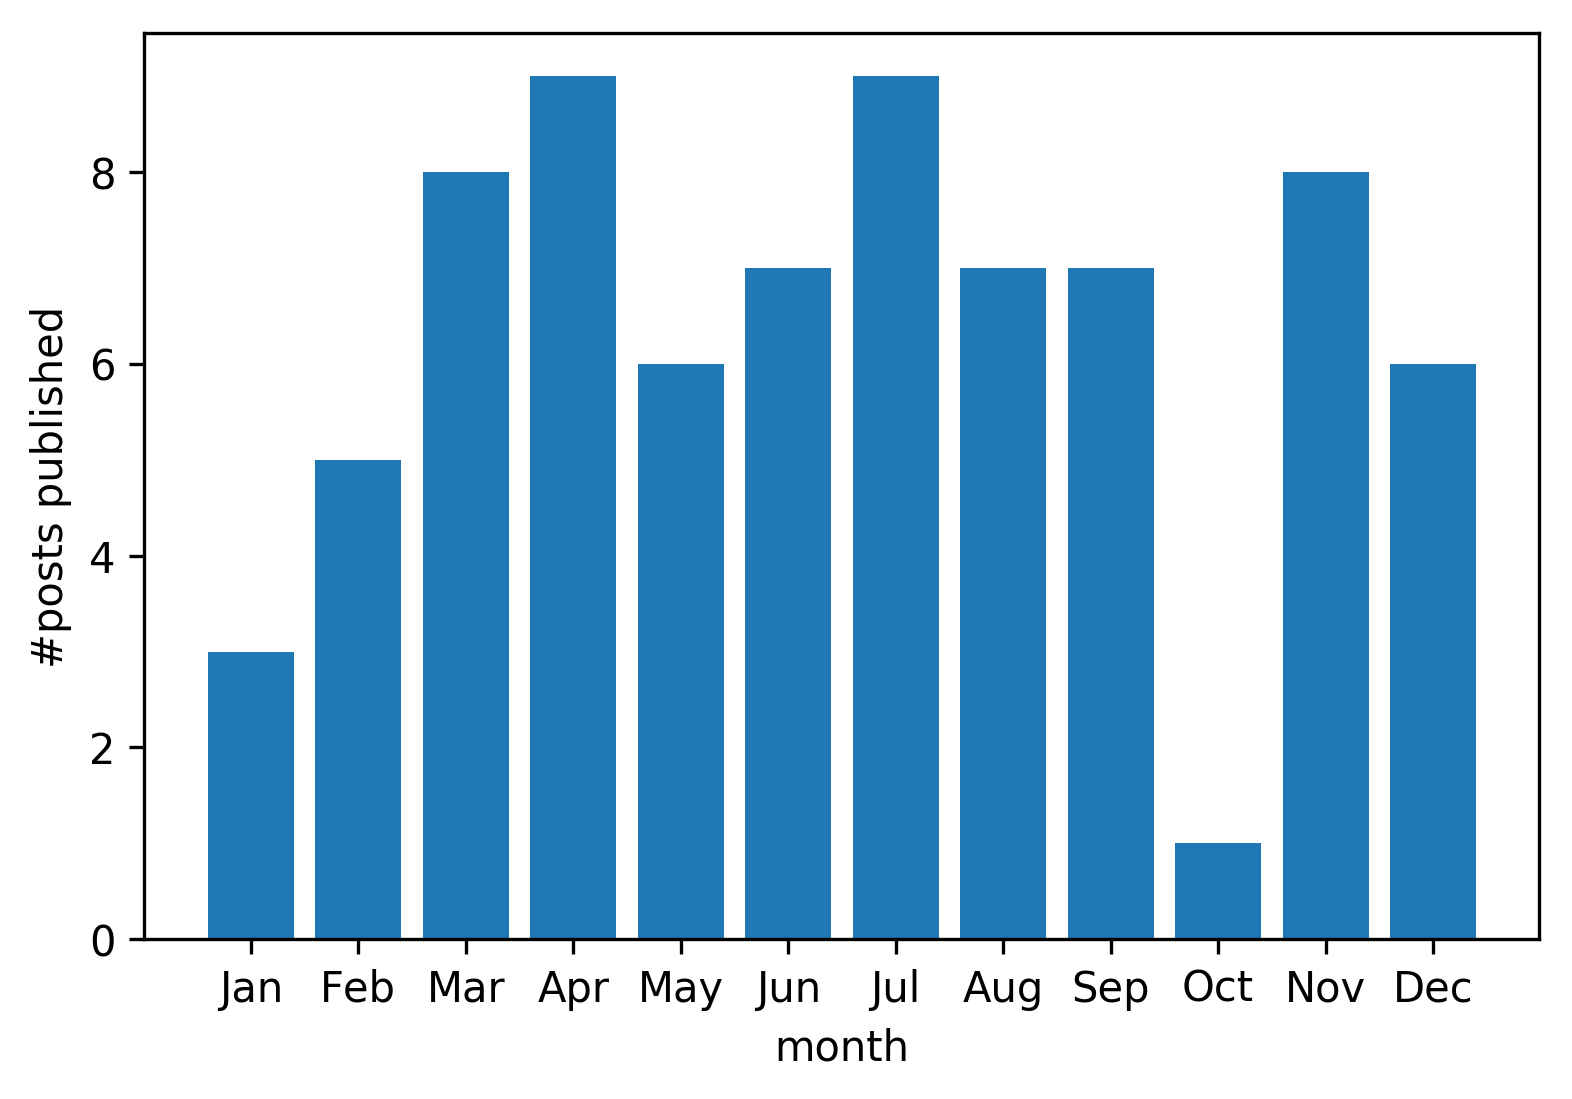
When looking per month only October is unusual. Unfortunately I was traveling and didn’t have much chance to write. It is peculiar to observe me ramping up in January and February and reaching steady state in March.
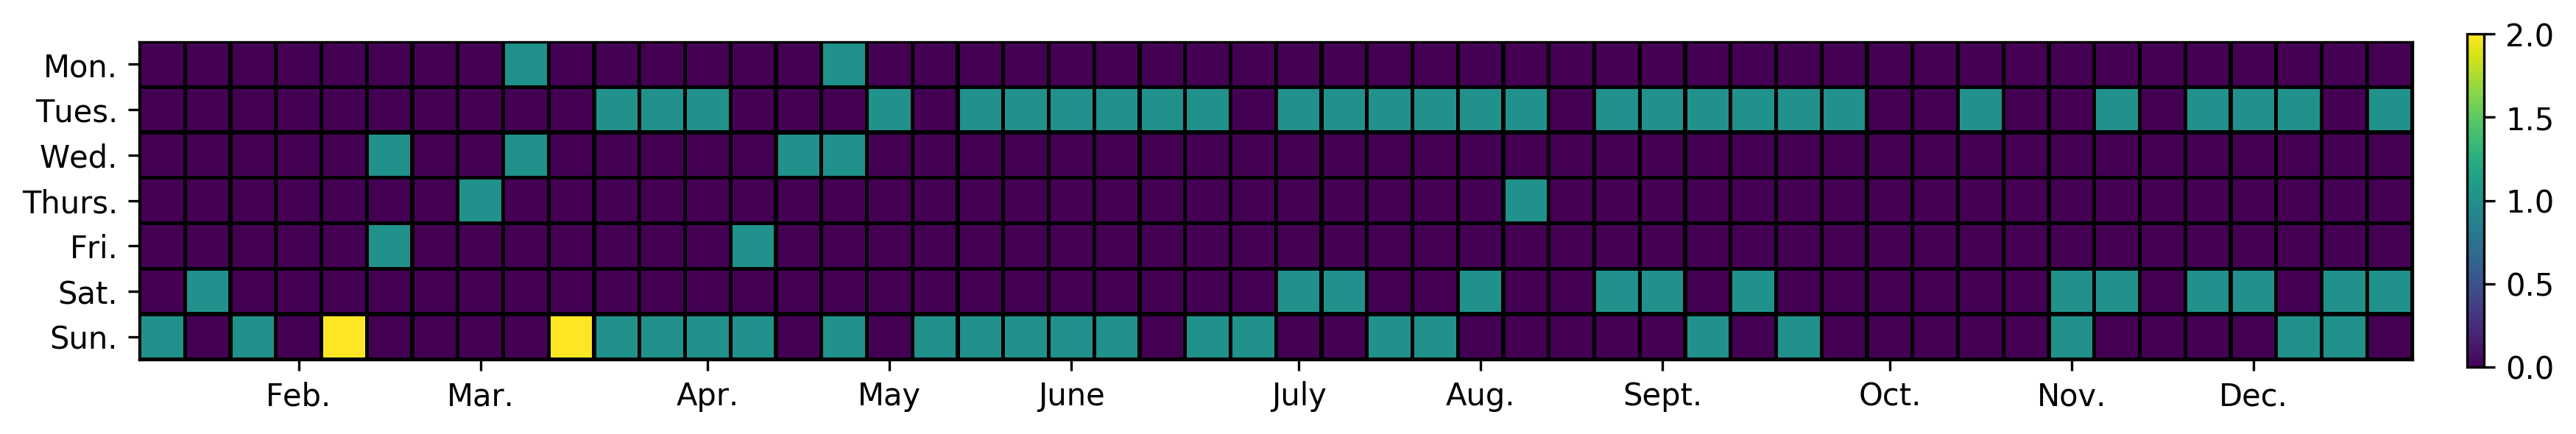
When looking at number of posts published per day for the entire year, we can definitely see how I started with no schedule and then in March switched to 2 posts per week.
Characters published
For simplicity I just look at file sizes, which may be different from number of characters one observes on the screen.
Let’s have a look at average post size in characters per day of week:
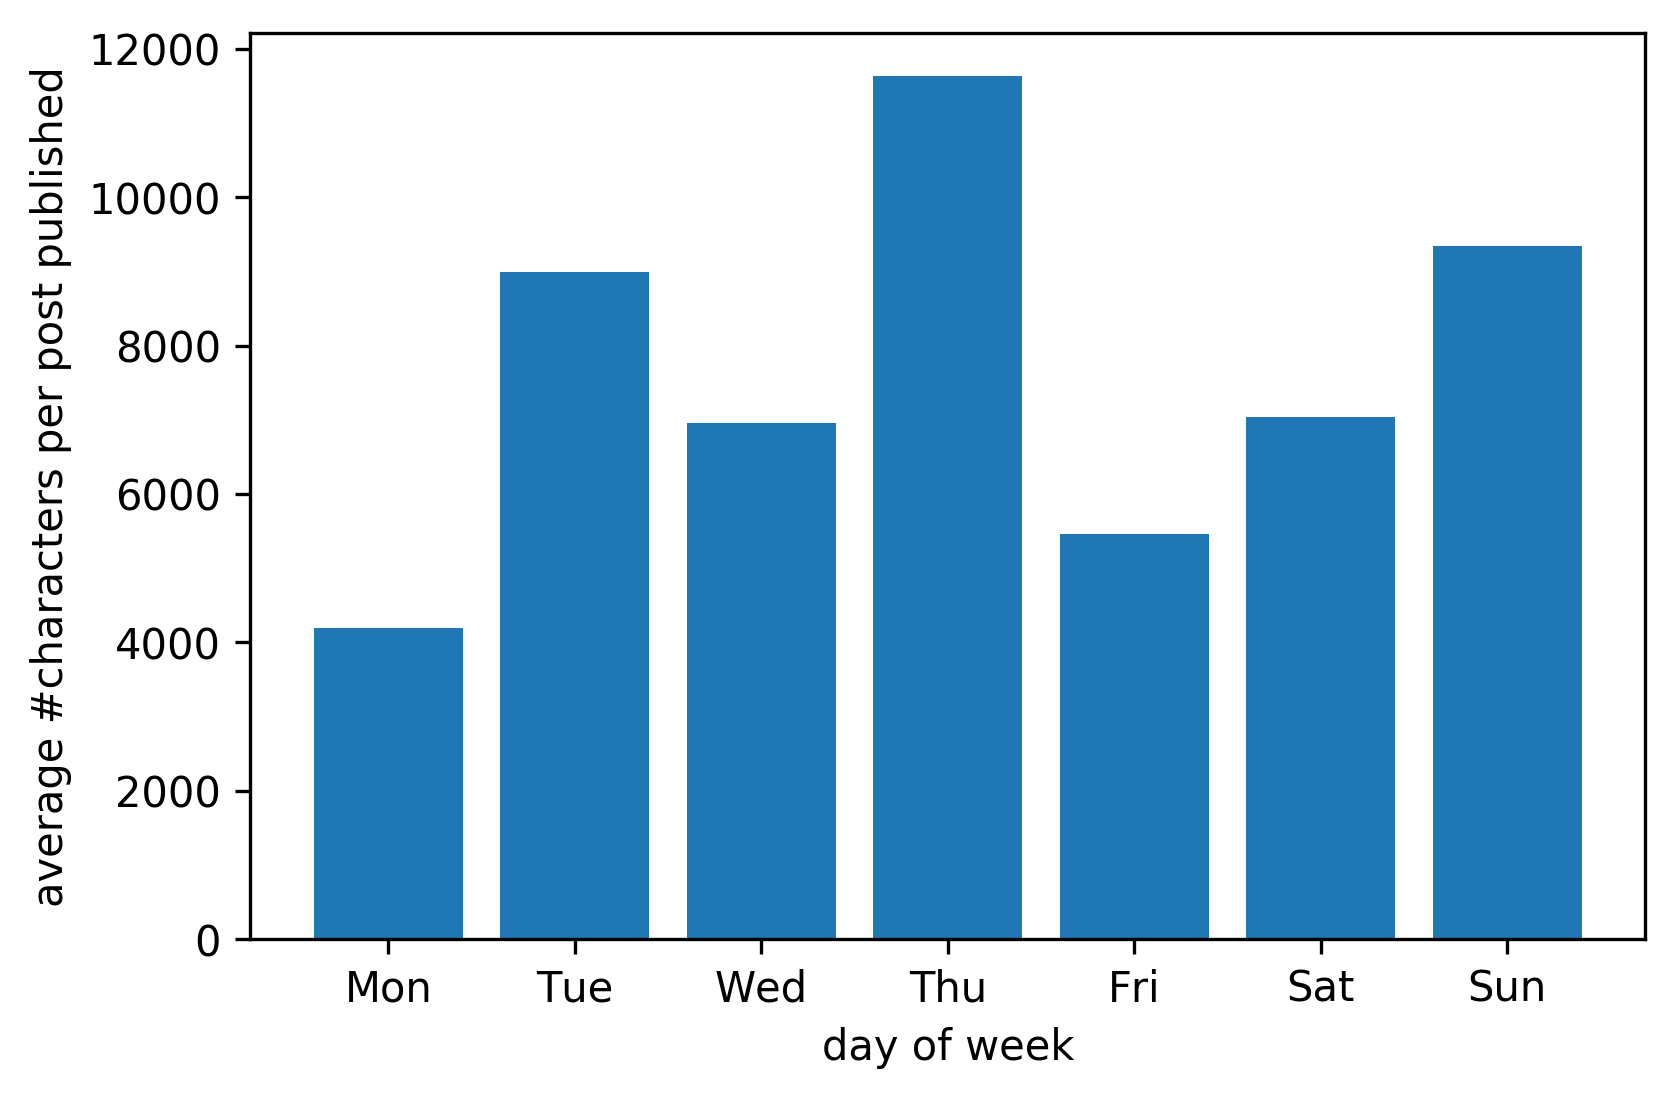
Somehow magically Thursday happens to have the longest average post. Actually there are only 2 posts on Thursdays - “Underestimating TER” and “Thought experiment #7 about true happiness” , both of which are 11-12k characters.
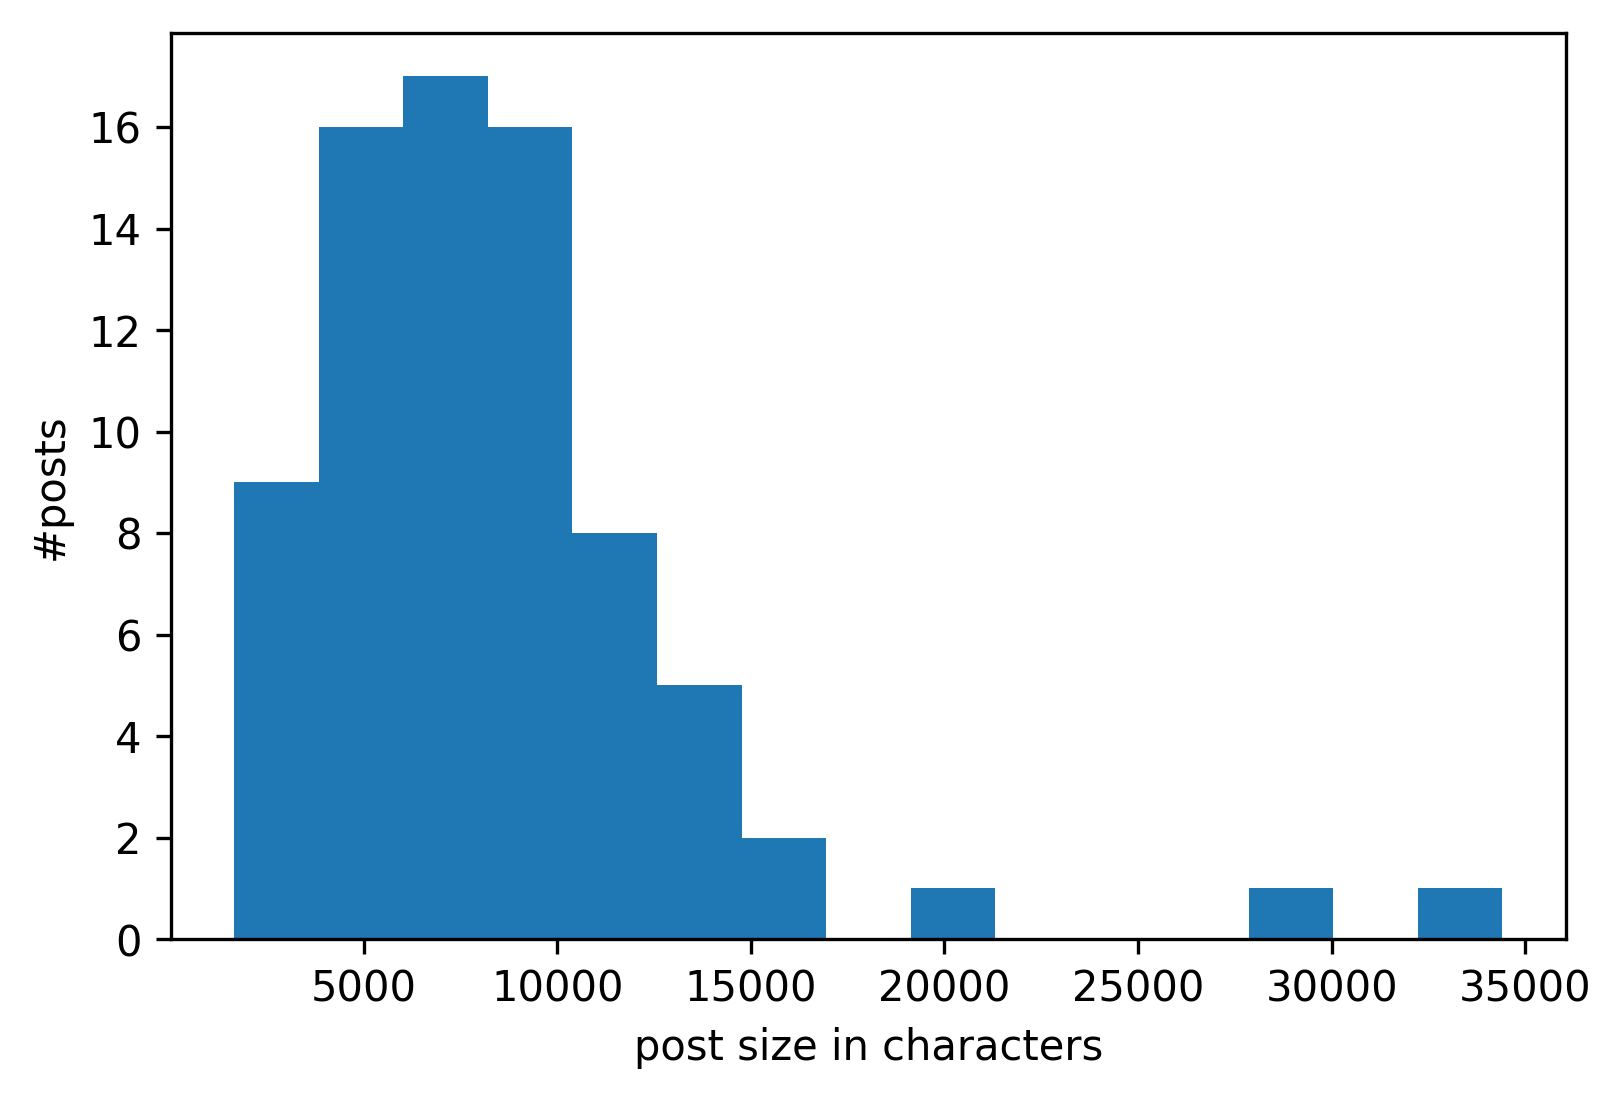
The longest post is the review of “The science of wellbeing” course. 34411 characters, I am not surprised.
The shortest one is about interactive brokers monthly fee, 1657 characters.
The median is the summary of “The dip” with 7505 characters.
When looking at a histogram of post sizes, we can see that almost all posts are up to ~15k characters with only few outliers.
Let’s have a look at characters published per day over entire year:
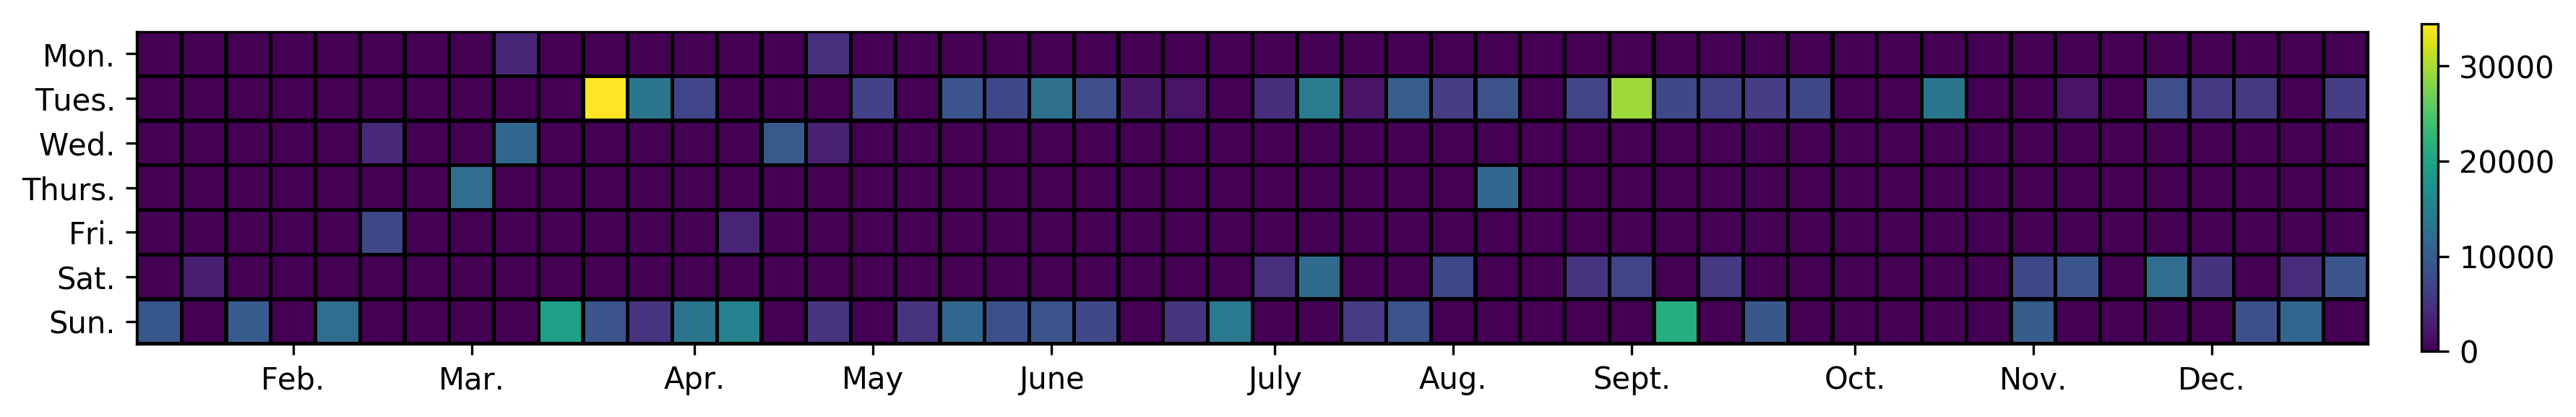
Some variation, but nothing peculiar.
Words
Top 10 most common words with their occurrence counts (case sensitive):
- ‘to’ - 2970
- ‘the’ - 2749
- ‘and’ - 2028
- ‘a’ - 1940
- ‘is’ - 1925
- ‘I’ - 1815
- ‘of’ - 1715
- ‘you’ - 1358
- ‘in’ - 1278
- ‘this’ - 1161
Funny that there is so much “I”, but fortunately “you” is not that far back. This quite matches the general distributing in English (e.g. Wiktionary). There you get 1.94 “I” for each “you”, while in this blog it is 1.33. In other words, it is more about you than an average English text. Yay!
Also I suspect that I sometimes don’t use “the” where I should (the count is lower than on average in English).
Some notable mentions:
- ‘time’, 450 occurrences, rank 27 vs 69 in English
- ‘people’, 369, rank 40 vs 135
- ‘something’, 259, rank 63 vs 219 (I should try using this less frequently)
- ‘FIRE’, 218, rank 69 vs 351 (for ‘fire’)
- ‘life’, 206, rank 74 vs 114
- ‘money’, 159, rank 96 vs 271
I think this illustrates well what this blog is about.
Popularity
The post with the most unique pageviews is about fixed vs tiered Interactive Brokers commissions. It also has the largest average time spent on the page. Somehow people find this topic very interesting. I myself was also confused by all the intricate details and that’s why I decided to write the post in the first place. I definitely didn’t expect it to become that relatively popular. It also gets the most interest in search engines and badly dominates all search clicks and queries. What a peculiar world.
The runner up in unique pageviews is luckiest investor. This one was peculiar and I did expect it to pique some interest. This post also became my by far most popular post on Reddit.
Afterword
So this is 2019 for “Merely Curious”. I am definitely looking forward to build similar graphs for 2020 after getting rid of publishing schedule. There must be much less structure there and, thus, observations to be made.
I am grateful to you all for motivating me! You are very welcome to contact me, I am definitely not overwhelmed by reader communication at this point. See my email and twitter below. Reddit would do too if you prefer.
Happy 2020 with plenty of beautiful stats!